


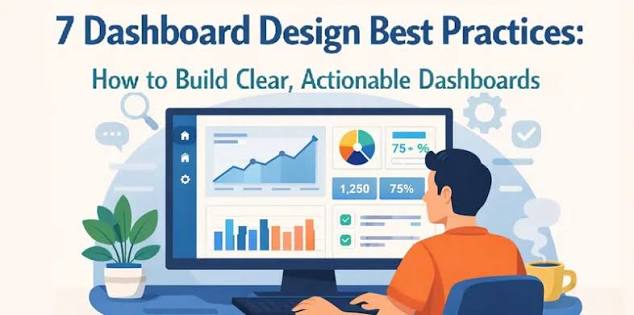
An event moves quickly. Registration lines build up, rooms fill, speakers change plans, and staff members need answers without having to search through spreadsheets or chat threads. A well-designed event dashboard puts the current situation into one focused view so teams can respond before small problems become larger ones.
The goal is not to display every available metric. It is to help the right person understand what is happening, what needs attention, and what to do next. Whether the event is an in-person conference, a virtual summit, or a hybrid program, clarity should take precedence over visual complexity.
Why Event Dashboards Matter
Event teams make constant operational decisions: where to move attendees, whether to add staff at check-in, which sessions need support, and whether a room change has been communicated. A dashboard reduces manual checking by gathering these signals in one place. The strongest dashboards do more than report activity. They make the next decision easier.
For example, a chart showing attendance is informative, but an attendance card that shows check-ins are 25 percent below the expected pace and links that change to a staffing task are actionable. More data is not automatically better data. Information only earns space on the screen when it supports a real decision.
Start With User Needs
Begin with people and tasks, not charts. A registration manager may need total check-ins, pending payments, and no-show patterns. An operations lead may need room capacity, delayed sessions, staff assignments, and open incidents. An executive may only need headline attendance, revenue, and major risks.
Questions To Ask Before Designing
- Who will open this view, and when will they use it?
- What decision should they be able to make immediately?
- Which tasks currently create delays or repeated questions?
- What information must appear without filters or extra clicks?
- What can remain in a detail view instead of the main screen?
Role-based views prevent one crowded screen from trying to serve everyone. Keep metric definitions consistent across views, but tailor the order and depth of information to each user’s responsibilities.
Choose The Right Metrics
Select measures that connect directly to event goals. Start with three to five primary metrics, then provide deeper details only when users need to investigate. Common metric groups include:
- Attendance: registrations, check-ins, no-shows, and attendance rate.
- Schedule: current sessions, delays, room changes, and upcoming activities.
- Capacity: occupancy, waitlists, available seats, and room limits.
- Engagement: questions, poll responses, content views, and session activity.
- Operations: open tasks, unresolved issues, staff coverage, and response times.
- Financials: ticket revenue, refunds, average order value, and registration costs.
Every metric should have a plain-language definition. If two people can interpret “attendance rate” differently, the dashboard should state whether it means check-ins divided by registrations, confirmed attendees, or another denominator.
Build A Clear Layout
Place the current state before detailed analysis. A practical screen structure starts with the event name, date, status, and last update time. Follow with priority metrics, then show alerts and tasks, trends over time, and detailed lists below. This visual order helps users scan from “What is happening?” to “Why?” and finally to “What should I do?”
Consistency also lowers the effort required to read each screen. Recent dashboard design research highlights how presentation choices, including layout and style reuse, are meaningful parts of dashboard authoring. Reuse familiar card patterns, status labels, and navigation locations so staff do not need to relearn the interface during a busy event.
Use Live Data With Care
Real-time data is valuable for making quick decisions about check-in volume, room occupancy, staffing, and session status. It can be unnecessary for metrics that are reviewed hourly or daily. Define the required refresh rate before choosing the technology, and make the screen refresh rate visible.
Live Data Design Checklist
- Show a clear refresh label, such as “Updated 2 minutes ago.”
- Separate confirmed figures from estimates.
- Use understandable loading, empty, and error states.
- Keep recent changes visible through timestamps or activity logs.
- Avoid constant animation that distracts from urgent information.
Add Alerts And Next Steps
Alerts make a dashboard a working tool instead of a passive display. Each alert should identify the issue, explain why it matters, and point to a next step. For instance, “Room A is at 92 percent capacity. Open overflow seating” is more useful than a red capacity number with no context.
Helpful alerts can flag a room nearing safe capacity, slower-than-expected check-ins, missing staff coverage, an unconfirmed speaker change, or a payment requiring review. Use priority levels sparingly. When every item is red, users stop recognizing what is truly urgent.
Design For Accessibility
Accessible design improves dashboard use for everyone, including people working on small screens, in bright venues, or under time pressure. Never use color as the only way to communicate status. Pair it with clear text, icons, or patterns, and keep contrast strong enough for essential labels.
- Use descriptive chart titles and status labels.
- Make filters and buttons easy to tap on mobile devices.
- Support keyboard navigation when the dashboard is used on a desktop.
- Write error messages that explain both the problem and the fix.
Test And Improve The Dashboard
Test the dashboard using common event-day tasks before launch. Ask real users to find attendance totals, identify a room issue, confirm the next session, or locate a staff assignment. Watch for hesitation, repeated clicks, and questions about labels. Those moments reveal design problems that a review meeting can miss.
Good dashboard design practices also include defining a clear purpose, aligning the audience with the information shown, selecting suitable visuals, and reviewing performance over time. After each event, remove low-value metrics and refine the screens people rely on most.
Common Event Dashboard Mistakes
- Showing every metric: Too much information hides the main message.
- Using unclear labels: Internal language can confuse temporary staff and new users.
- Hiding urgent items: Critical tasks should not be buried under several menus.
- Mixing audiences: One screen rarely works equally well for every role.
- Ignoring empty states: A blank chart can make a healthy system appear broken.
- Skipping reviews: Old metrics can remain long after they stop helping.
Frequently Asked Questions
What Should An Event Dashboard Show First?
Show the current event status, the highest-priority performance figures, and any issues that need immediate attention.
How Many Metrics Should A Dashboard Include?
There is no fixed number, but the main view should stay focused. A small set of priority measures is usually more useful than a wall of charts.
Should An Event Dashboard Use Real-Time Data?
Use it for fast-moving operational decisions. Slower metrics can update on a schedule, as long as the dashboard makes the refresh timing clear.
Conclusion
An effective event dashboard is defined by the decisions it improves, not by the number of visualizations it contains. Give each audience a focused view, make data freshness and definitions clear, surface urgent issues, and test the experience in realistic conditions. With a clear structure and regular review, the dashboard becomes a dependable guide when the event is moving fast.